Significance of correlation in statistics Article Swipe
 YOU?
·
· 2021
· Open Access
·
· DOI: https://doi.org/10.54660/.ijmrge.2021.2.6.317-318
· OA: W4386183266
YOU?
·
· 2021
· Open Access
·
· DOI: https://doi.org/10.54660/.ijmrge.2021.2.6.317-318
· OA: W4386183266
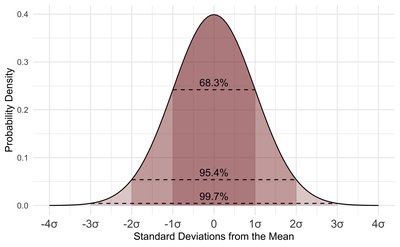
Correlation quantifies the degree and direction to which two variables are related. Correlation does not fit a line through the data points. The sign (+, -) of the correlation coefficient indicates the direction of the association. The magnitude of the correlation coefficient indicates the strength of the association, e.g. A correlation of r = - 0.8 suggests a strong, negative association (reverse trend) between two variables, whereas a correlation of r = 0.4 suggest a weak, positive association. A correlation close to zero suggests no linear association between two continuous variables. Linear regression finds the best line that predicts dependent variable from independent variable. The decision of which variable calls dependent and which calls independent is an important matter in regression, as it'll get a different best-fit line if you swap the two. The line that best predicts independent variable from dependent variable is not the same as the line that predicts dependent variable from independent variable in spite of both those lines have the same value for R2. Linear regression quantifies goodness of fit with R2, if the same data put into correlation matrix the square of r degree from correlation will equal R2 degree from regression. The sign (+, -) of the regression coefficient indicates the direction of the effect of independent variable(s) into dependent variable, where the degree of the regression coefficient indicates the effect of the each independent variable into dependent variable.