Explanipedia Public Learning Modules Vs Mis Dis Mal Information:


Description
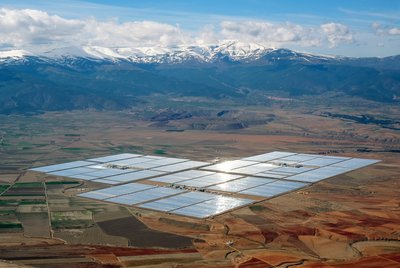
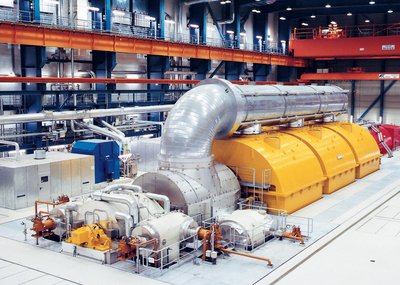
The duck curve is a graph of power production over the course of a day that shows the timing imbalance between peak demand and solar power generation. Used in utility-scale electricity generation, the term was coined in 2012 by the California Independent System Operator.
Duck Curve News
Loading news…
Tags
Flexibility
(16.1K)
Power
(9,389)
Tenacious
(9,258)
Visionary
(6,043)
Conflict
(5,788)
Imaginative
(3,977)
Change
(3,621)
Energy
(2,586)
Control
(2,500)
ClimateChange
(1,994)
RenewableEnergy
(1,387)
Adventurous
(587)
Electricity
(462)
CarbonFootprint
(349)
Renewable
(301)
Inquisitive
(105)
Demand
(88)
Grid
(77)
SolarPanels
(3)
Collections
No collections available for this topic.